The problem of building simple yet informative task graphs is daunting if no task management software is used. Such software allows creating task hierarchies and categorized todo lists and then building corresponding diagrams and charts. When you have a graph representation of task statuses and progress, you can get a more convenient view of information on task performance and employee productivity. You can create printable, hierarchical job sheets and use them at meetings to show task progress as diagrams.
VIP Task Manager is task management software that helps you manage todo lists and schedules and create diagrams ad charts. The software features Charts panel that lets you build task graphs without wasting time on defining multiple parameters. The panel has five charts, including Pie Chart and Bar Chart. You can create a chart by using two task parameters. For example, to build a chart that allows comparing time spent and time planned, you can choose Actual Time and Estimate Time from the drop-down list on the panel. The software will let you print out your charts.
,
Action plan
- Launch VIP Task Manager and log in your database.
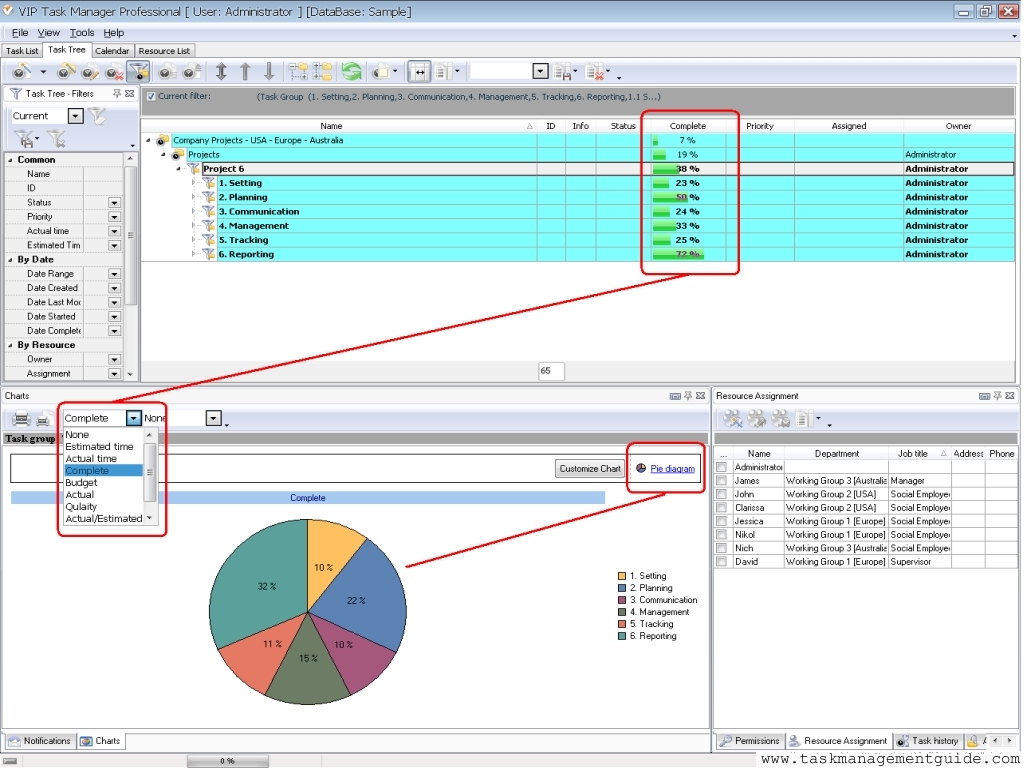
- To build a chart, go to Task Tree view, select a task group and then go to Charts panel. Select chart type (e.g. Pie Chart, Line Chart) and choose two parameters from the drop-down list on the panel.
- To print out your chart, use Print Preview option on the panel.

|
| |||
|
|
 |
VIP Task Manager |
|