

Control the time that you spent on the project
When the project is already accomplished, it's useful to compare the time that was estimated for its tasks at the beginning of the work and the time that was actually spent. By analyzing the difference between them, you and your colleagues can make up a conclusion about your productivity or procrastinations. Constant control under the time that you spend on the tasks will give you a possibility to discover whether you have any problems with time management, and to start working at your self-improvement in time.
"Reports on Actual and Estimated time" To Do List
- When the project is completed, don't give it up at once
- Pick out the tasks that are related to this project and record the time that you actually spent on them
- Use software to make graphic report on project Estimated and Actual time and print it out
Action plan
- Start your task management software
- Set filter by required project's task group
- Enter task's Actual time
- Go to Charts panel and select 'Estimated time' from the first drop-down list and 'Actual time' from the second drop-down list on Charts toolbar
- Print out the report
See also:
Easy and quick report on particular tasks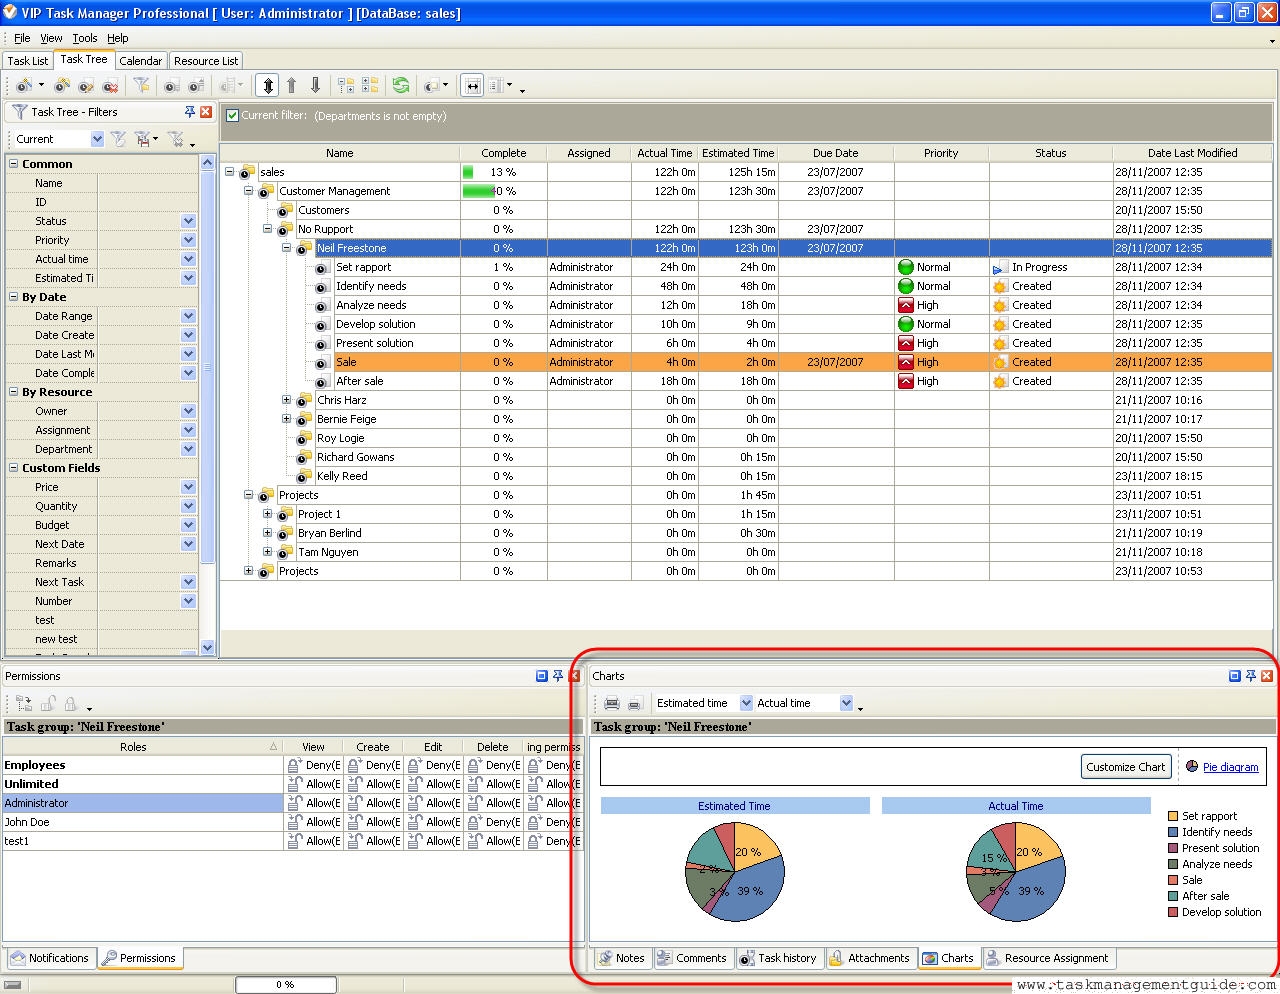

|
CentriQS Reporting Tasks Solution CentriQS offers several tools for task reporting. Users can work with Pivot grid, generate charts and use Time Logs view which lets filter, group and sort time logs for creating time tracking reports. These reports can be used for various purposes such as performance measuring, payroll calculating, client billing, etc.
|
|