

Graph reports on task progress are a convenient and quick way to get imagination about how your employees perform their tasks and whether they should be pushed on to meet project objectives. If you are a team-leader, you probably need to know what overall progress of assigned tasks and which employees of your team endanger the whole process.
VIP Task Manager allows to build completion reports for a task or a task group in easy and quick manner. The software has several chart types which help you analyze task performance of your team and get printed copies of charts. For example, In VIP Task Manager you can choose Pie Diagram to graphically represent overall task progress of the task group as a circle divided into zones. Each zone corresponds to a particular task inside the task group. In such a way you will convenient graphic report of task progress.
Action plan:
- Launch VIP Task Manager and enter your company database.
- Select a task group that contains tasks to be included in graph report.
- Go to Charts panel.
- Choose one of five chart types: Bar diagram, Line diagram, Pie diagram, Area diagram or Column diagram.
- Select "Complete" value from the drop down list on Charts panel.
- Go to Print Preview to check how the report will be printed out.
- In the Print preview, press on Print button to get hard copy of the report.
See also:
Easy and quick report on particular tasks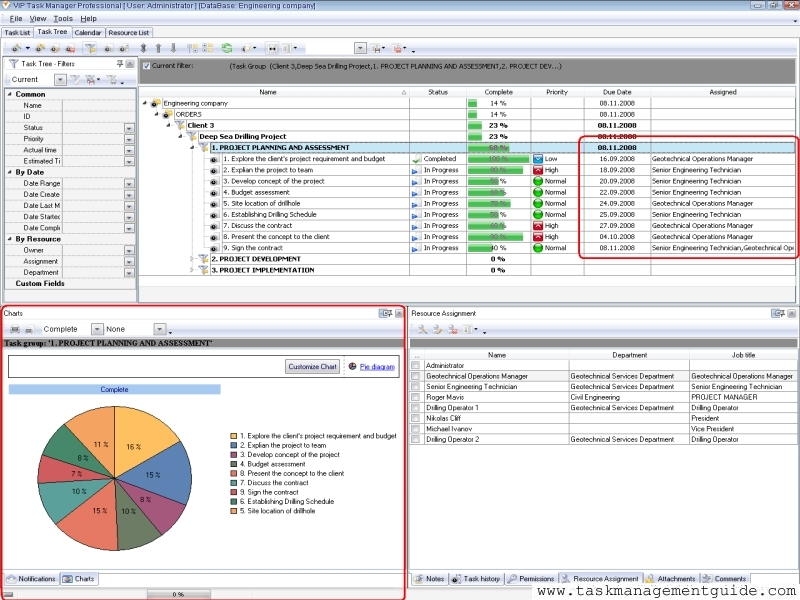

|
CentriQS Reporting Tasks Solution CentriQS offers several tools for task reporting. Users can work with Pivot grid, generate charts and use Time Logs view which lets filter, group and sort time logs for creating time tracking reports. These reports can be used for various purposes such as performance measuring, payroll calculating, client billing, etc.
|
|