

|
| |||
|
|
 |
VIP Task Manager |
|

|
| |||
|
|
|
VIP Task Manager |
|
|
For a careful learning the outcomes of task performance managers require a graph tool to represent task progress in diagrams and charts that could serve as a fine tool for assessment of task performance. Sometimes tracking and analyzing tasks with diagrams is quite better, quick and convenient way than watching those tasks in usual breakdown structure. Task performance in graphical view allows getting clear imagination of task progress, create easy-to-read presentations, generate reports and drawing up plans and schedules for a project. |
||
|
Usually an employee task management software has a set of graphic tools that allow to output task data in diagrams. A set of charts supported by VIP Task Manager provides the software users with capability to generate reports and output data for a single task, task group or for the whole project in graph view. This set of charts includes the following diagram type: | ||
|
 |
|
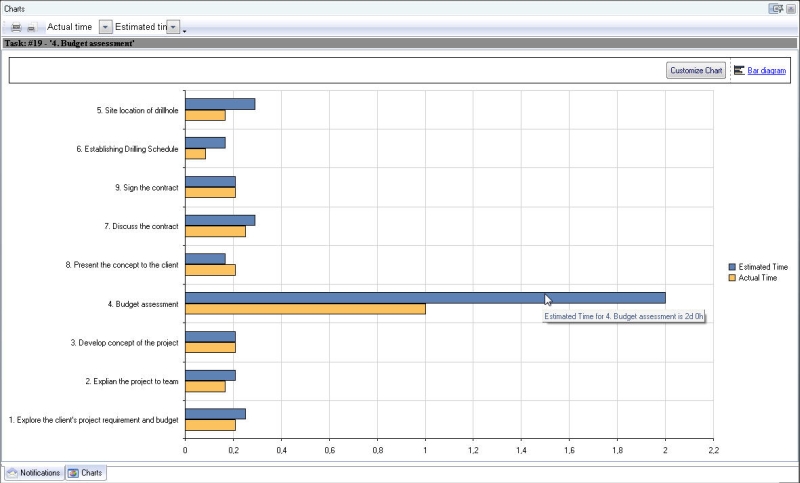
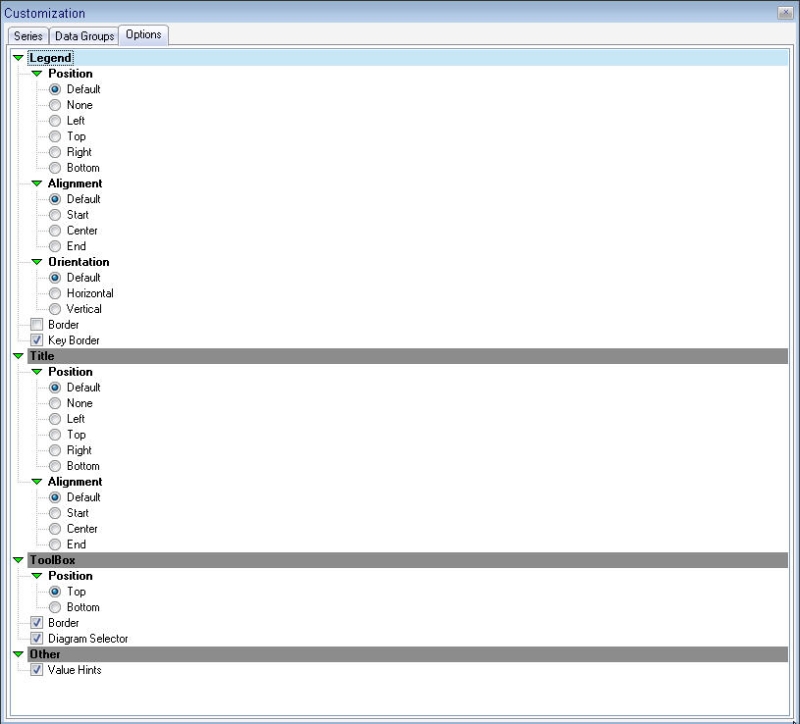
By these charts you can compare any two values. For example, in drop-down list in Charts panel there are default values listed: Estimated time, Actual time and Complete. Using Estimated time value and Actual time value, you can get chart of time spent by a resource to perform the task in easy-to-read view. On the screenshot you can see Bar diagram that demonstrates deficiencies between actual and estimated time. This diagram can be printed out. In addition each type of diagram can be customized by user. For example, you can move legend to any convenient place on the chart or just make it hidden using chart customization option. You can sort values on the chart, set borders of bars, hide diagram selector, etc. |
||
|
Using custom field you can add a field to the task and then display it in Charts panel. For example, you need a comparison chart when a resource started a task and finished it. You can create custom field "Task Duration" and using custom field option specify formula for calculating the field. Once the custom field "Task Duration" has been created, it was added to the drop-down list on the Charts panel. |
 |
|
|
If to sum up all features of the Charts panel, VIP Task Manager gives the following benefits to the users:
|
||
 Play Demo
 Play Demo
|
| |||
|
|
|
VIP Task Manager |
|