
When doing workflow improvements, should a manager carefully chart the current progress and examine it so as to find opportunities for improvement? The answer is yes, and progress charting will help. Progress charting is the key component of decision making within workflow management. Progress of every task within the workflow should be charted separately over each day/week/month in order to create the vision of the total workflow progress. Task progress charting allows using periodical charts to compare the progress from week to week, from month to month. This is the way to detect productivity gaps in the workflow so that the manager can analyze each phase of the workflow, reveal fails and take immediate actions to improve the workflow.
In order to create a progress chart and divide the workflow into a set of consistent tasks, you can use VIP Task Manager. This program is a kind of shareware that brings functionality for building charts, customizing task statuses. VIP Task Manager allows to notice when an employee is out of the schedule by creating the task progress diagram on the daily basis or over a period of time. There are five kinds of charts available in VIP Task Manager, including the most used Pie chart and Column diagram. Each chart displays tasks located in a task group, so you can monitor the progress per task as well as see the total progress in percentage terms.
- Run VIP Task Manager
- In Task Tree view, create a list of tasks in common task group. Change progress of the tasks
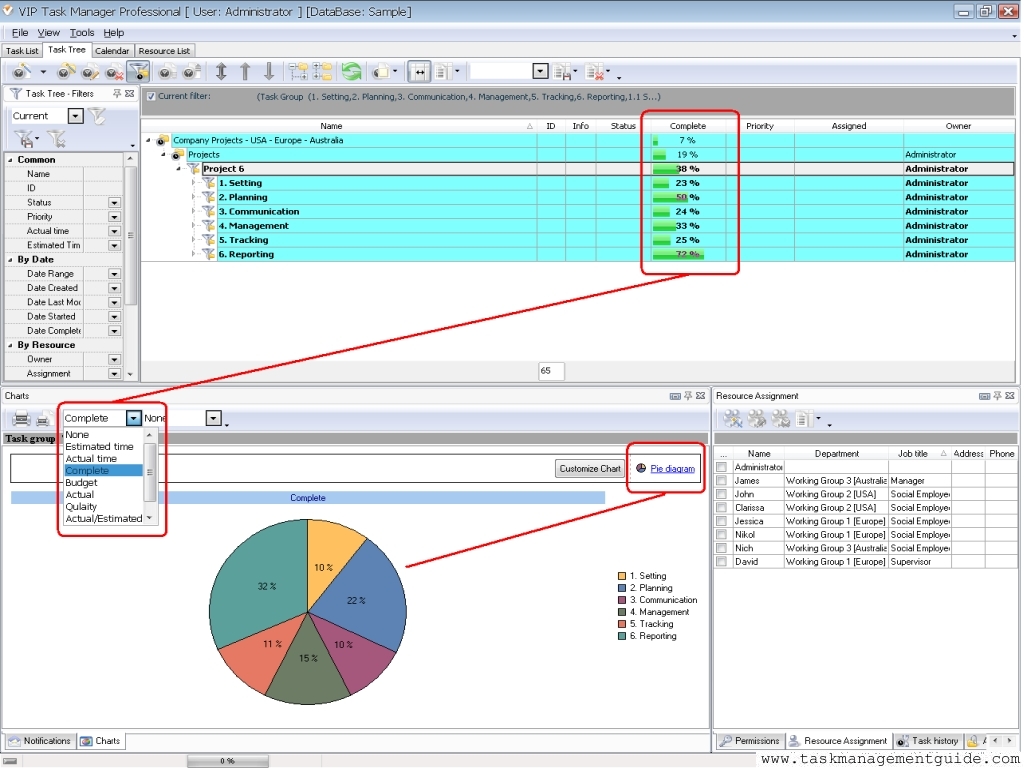
- Go to Charts Panel and select a kind of chart you need (Pie, Column, Line, Bar or Area chart)
- Select the task group and go to Charts Panel to choose 'Complete' value in drop-down list
- Charts Panel allows to print out charts
- Through the charted progress of the task group you can monitor which task is out of schedule
When you are delegated a task, think if you are able to accomplish it

|
CentriQS Tracking Tasks Solution Task Time Tracking in CentriQS is very flexible. Users can track time they spend on tasks both manually by entering actual/remaining task duration or adding time logs and automatically by using task timer that adds time logs when you pause or stop it. Task property "Deviation" informs users whether they are "On Schedule", "Ahead of Schedule" or "Behind Schedule" by calculating the difference between "Estimate" and "Actual+Remain". |
|