

Time spent on report creation can be saved
It's often required to give the leader reports on the time that was spent on some tasks by different employees or the whole departments. Such reports allow tracking the productivity of each department or team member and comparing which one can more effectively manage their work. But making report may become a time-consuming task, if not automated. By using specific software you can minimize the time spent on report's creation.
"Actual time reports" To Do Lis
- Define the time period you need to report about
- Pick out the tasks that are already completed by required employees or departments
- Use software to make report on task Actual time of required employees or departments
Action plan
- Start your team management software
- Set filter to display only completed tasks from required time interval
- Group the tasks by 'Department' or 'Assigned' field
- Go to Charts panel and select 'Actual time' from the drop-down list of Charts toolbar
- Print out the chart
See also:
Make graphic reports on the project accomplishment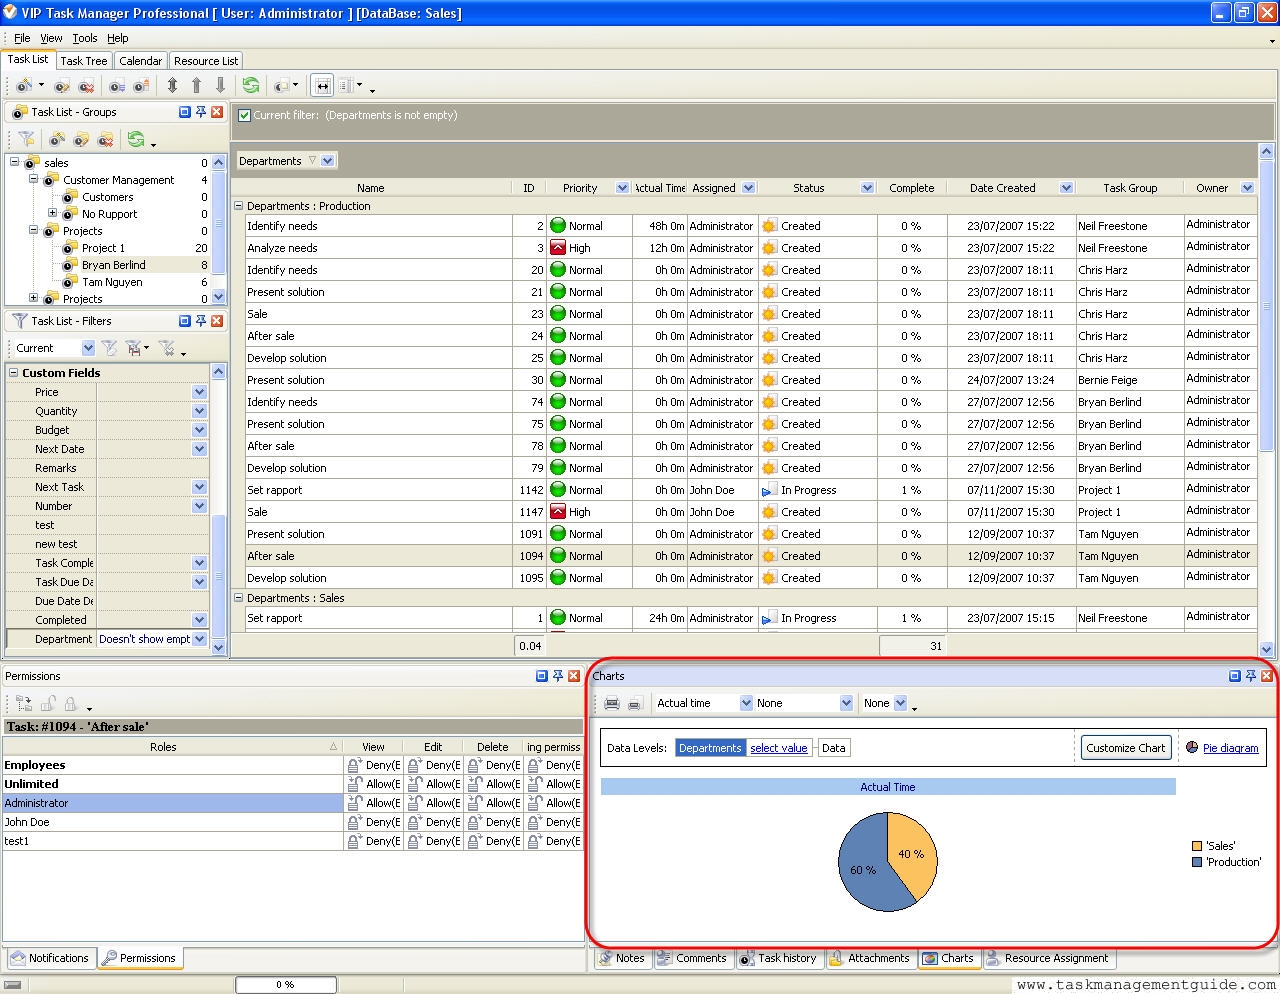

|
CentriQS Reporting Tasks Solution CentriQS offers several tools for task reporting. Users can work with Pivot grid, generate charts and use Time Logs view which lets filter, group and sort time logs for creating time tracking reports. These reports can be used for various purposes such as performance measuring, payroll calculating, client billing, etc.
|
|