

Use charts while making reports
While team members are working on some project, they most likely need to make reports on project accomplishment. They have to estimate how much is already done and how much still should be done. The easiest way to do it is to diagram what part of the project is completed, what is still not and to visualize the completion degree of undone tasks. Such graphic reporting can lighten the process of creating the detailed report on the project for the employees and make it easier for the manager to perceive obtained information he/she is interested in.
"Reporting the project" To Do List
- If you need to demonstrate the state of the project you are currently working on to your team leader, do it with the help of the chart
- Describe on the diagram how many tasks are already done, how many of them are 50%-done, 30%, etc
- Use software to make a graphic report on the project
Action plan
- Start your task management software
- Set filter by project task group you need to report about
- Go to Charts Panel and select "Complete" field from drop-down list on Charts toolbar
- Print out the chart
See also:
Use software to make reports on task due date deviation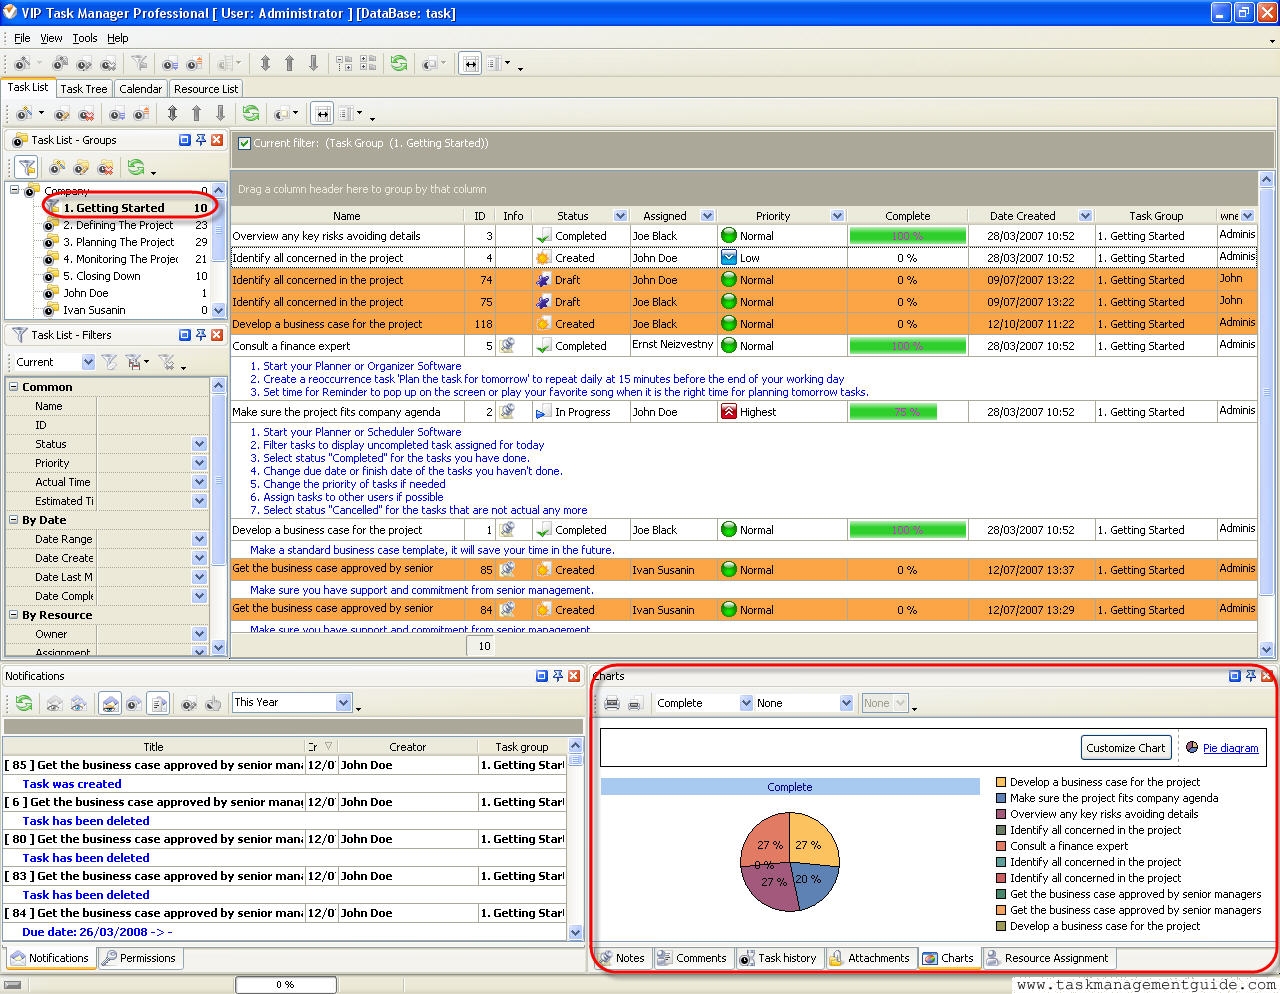

|
CentriQS Reporting Tasks Solution CentriQS offers several tools for task reporting. Users can work with Pivot grid, generate charts and use Time Logs view which lets filter, group and sort time logs for creating time tracking reports. These reports can be used for various purposes such as performance measuring, payroll calculating, client billing, etc.
|
|