

Use software to save time and efforts
In our business life we often face the necessity to make some statistics calculations per the projects or groups of tasks. For example, you need to calculate total budget obtained as a result of several sales operations. It takes much time and energy especially when there is a great volume of data. Why waste the time on the task that can be automated with the help of software. It would be more effective to automate the calculation process, use saved time for other more important tasks and in that way increase your productivity and save the efforts.
"Automate calculations" To Do List
- Pay attention what kind of calculations you frequently make to get some statistics per the project or the tasks you've done
- Think if it's possible to arrange this data and calculations in such a way that they can be automated
- Use software to store the data and calculate them
Action plan
- Start your task management software
- Create a new task group, e.g. 'Project 1'
- Create a new custom field, for example 'Budget'
- If required, make it aggregated per other data, e.g. budget = quantity * price
- Make it aggregated for the task group, e.g. count the total budget for 'Project 1' task group
See also:
How to make reports on the time spent by different departments or employees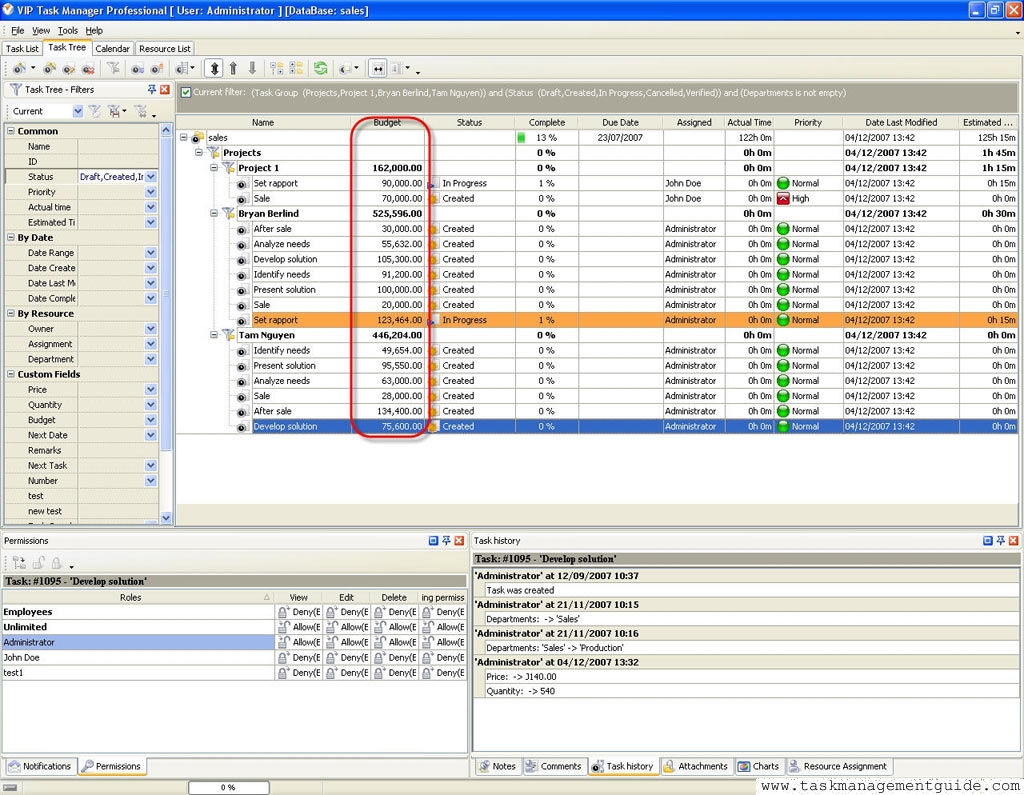

|
CentriQS Reporting Tasks Solution CentriQS offers several tools for task reporting. Users can work with Pivot grid, generate charts and use Time Logs view which lets filter, group and sort time logs for creating time tracking reports. These reports can be used for various purposes such as performance measuring, payroll calculating, client billing, etc.
|
|