 |
VIP Task Manager has capabilities to create reports in text and graph view. Each employee should execute the task "9.Reporting to Department Head" and report on task status. This task is assigned to all employees involved in filling of customer order. Employees can set reminder to this task in order to give a task report in time. Reports in MS Excel and HTML formats | |
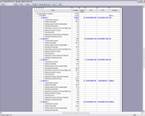
| VIP Task Manager allows to look through reports on tasks in the sheets of Microsoft Office Excel or in HTML format. The employees of the transportation company can build reports in VIP Task Manager and then export them to MS Excel. This gives the chance to the employees to choose what fields should be displayed in the report, and also quickly to change a way of report display without necessity to edit it in VIP Task Manager. Owing to such flexibility, export of reports to MS Excel is more convenient and fast way of report creation in comparison with use of reports in format HTML. Once the report was build and exported to MS Excel, the employee can attach it to letter and send the letter to his manager by email. | ||
|
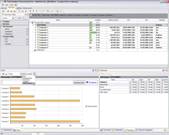
Reports in graph view Building charts is the way to show task list status in graphic view. This kind of report can be applied by managers of the transportation company. For example, the head of Sales Department need to see all delivery periods in order to check if there are delays in deliveries and to plan future shipments. |
 |
|
 |
He can use Charts Panel to build Bar Diagram that shows delivery period for each customer in the company database. Besides Bar Diagram there are also Column Diagram, Linen Diagram, Pie Diagram and Area Diagram in VIP Task Manager. The department head can use Column Diagram to watch the chart of customers' order statuses. This chart will show status of customers' orders in percentage points. |
|
|
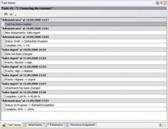
Task History All tasks changes are recorded in VIP Task Manager. The employees of the transportation company can look through the task history in Task History panel. The panel shows task changes and this can be applied as a report for analyzing employee task performance by department heads of the transportation company. The task history can be printed out by using Print Preview mode. |
||
|
||
 |
|
 |
VIP Task Manager |


